
Introduction to Dendrochronology
As I have recently bought a small wooden box with three layers of different paint and even the uppermost layer seeming to be from around 1800 - 1830, I decided to try something new for me: Dating the wooden box, or at least the tree it was made of, using Dendrochronology.
To be fair: Dendrochronology still feels to me a bit like reading from coffee grounds, even though I know the theory behind it. A lot of the method is about good measurements, statistics and knowing what dated series to choose.
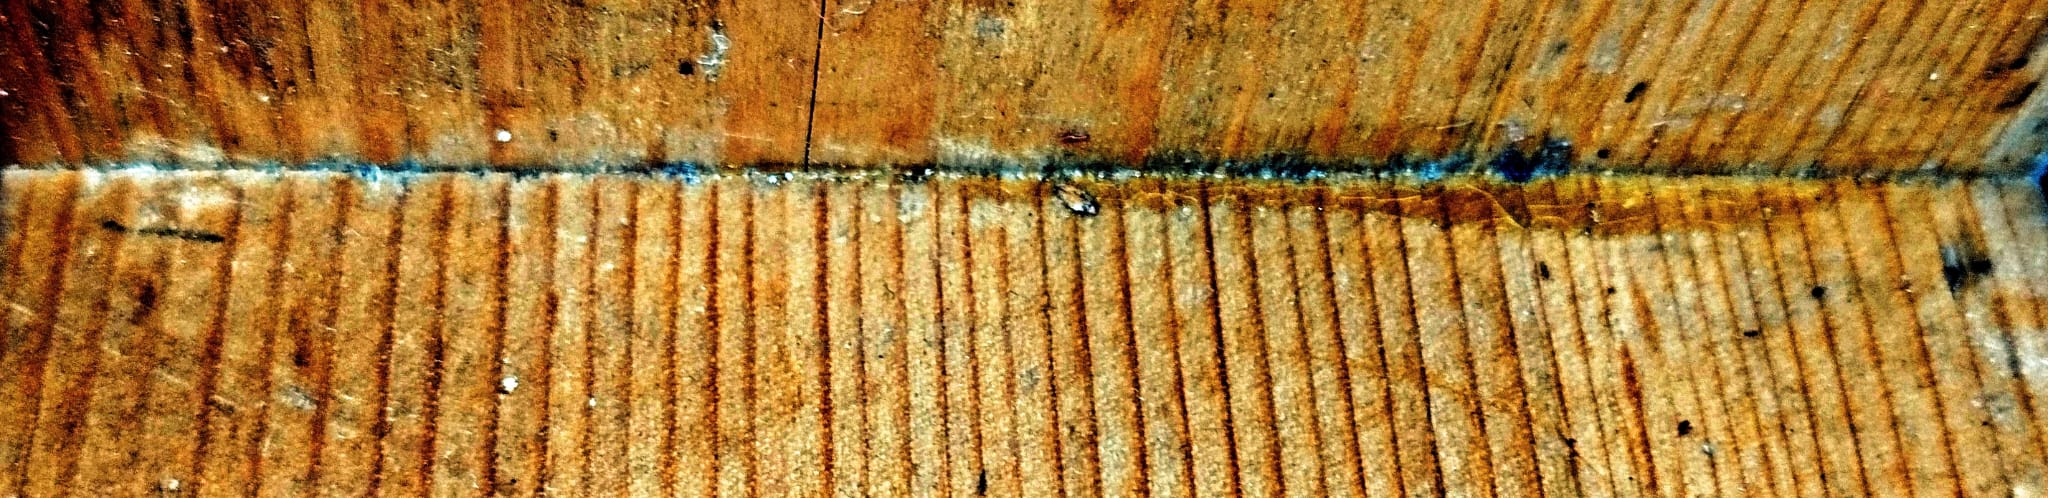
1st Step: Taking really good pictures of the wood grain.
This is critical and the first step to taking good measurements. The wood grain hast to be visible either from the top, so with real rings or that there are only parallel lines in the wood, i.e. one side of it originating from the core of the tree.
2nd Step: Converting the image to measurements
Next, you need to convert the image to a .rwl-file. For that, I recommend MtreeRing .
On Debian Linux, you can install it via:
sudo apt update && sudo apt install -y r-base r-base-dev build-essential gfortran cmake pkg-config libmagick++-dev libcurl4-openssl-dev libssl-dev libxml2-dev libfontconfig1-dev libfreetype6-dev libpng-dev libjpeg-dev libtiff-dev r-cran-fs r-cran-sass r-cran-bslib r-cran-shiny r-cran-magick
Rscript -e "install.packages('MtreeRing', repos = c('https://ropensci.r-universe.dev', 'https://cloud.r-project.org'))"
And start it via:
Rscript -e "MtreeRing::ring_app_launch()"
Now you can upload your image in the UI. Rotate and crop it as you like, if needed:
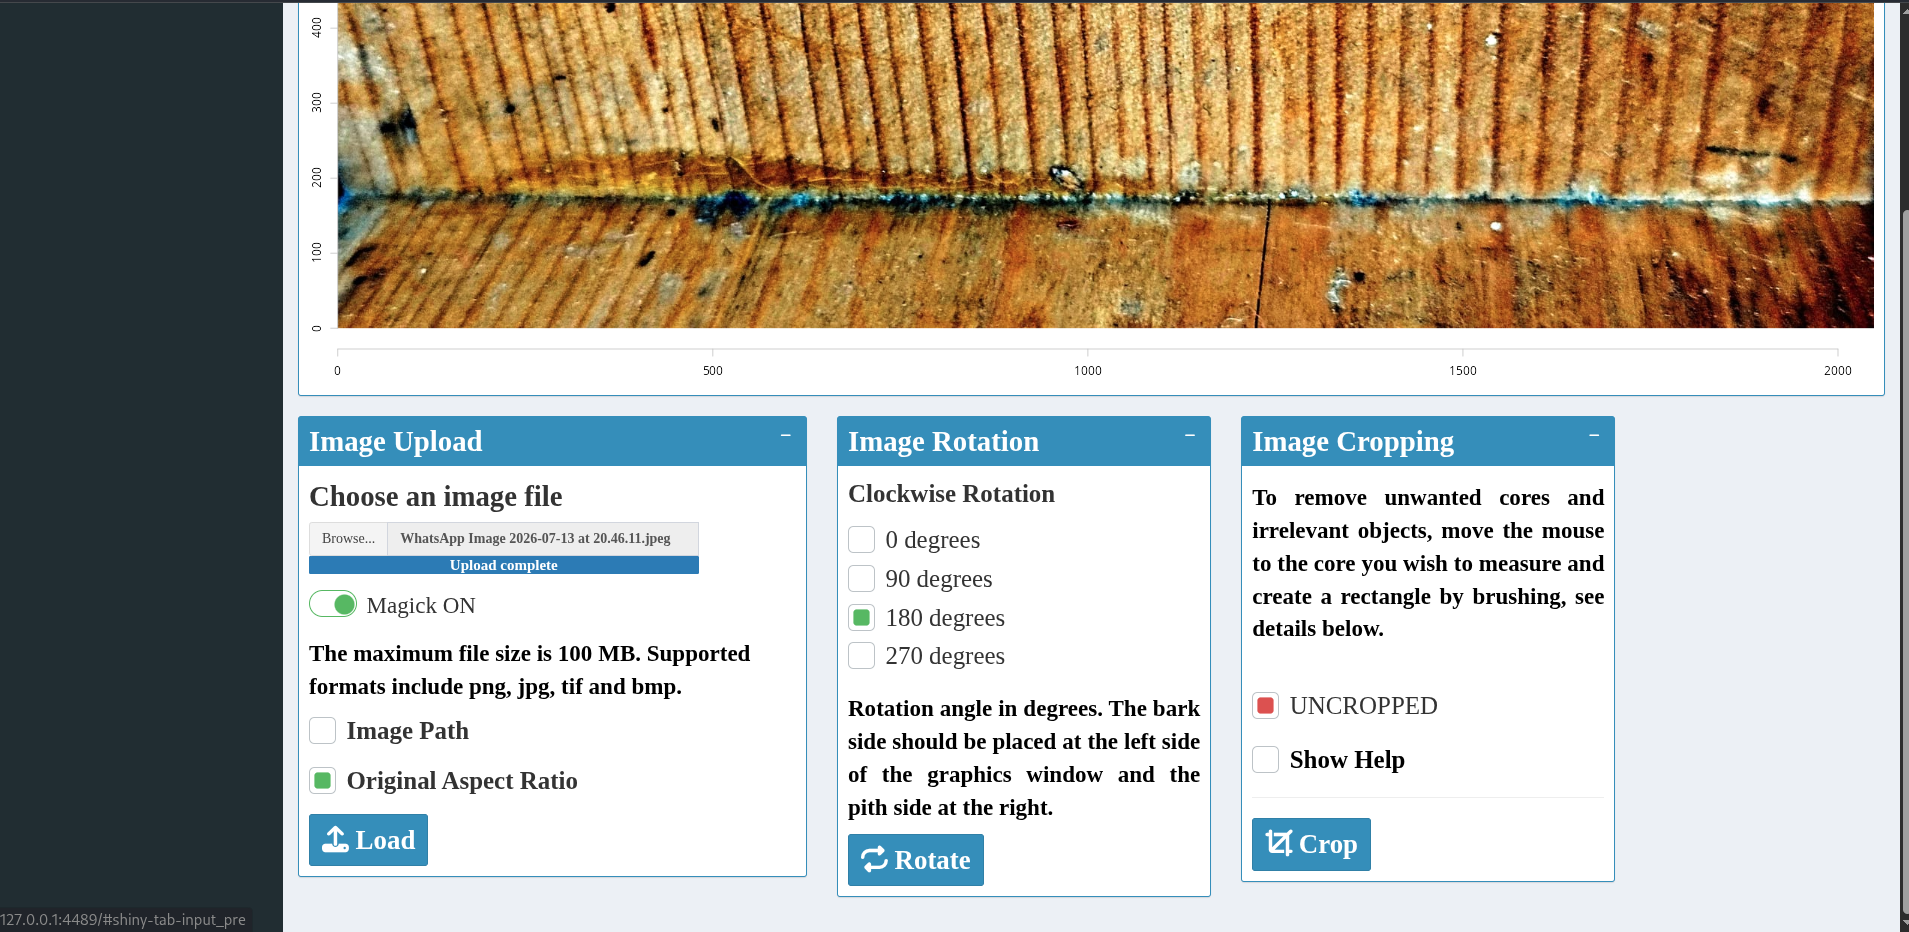
To make measurements, you have to switch to the "Measurement"-tab on the left. Scroll down to the "Main Window" and create a path along the grain direction by double-clicking the start and end points.
Since, for me, the automatic detection seemed not to work, I skipped the "Ring Detection"-tab and went directly to the "Ring Editing"-tab to manually add the rings as points along the path. Make sure to mark them as accurately as possible to get better results later on:
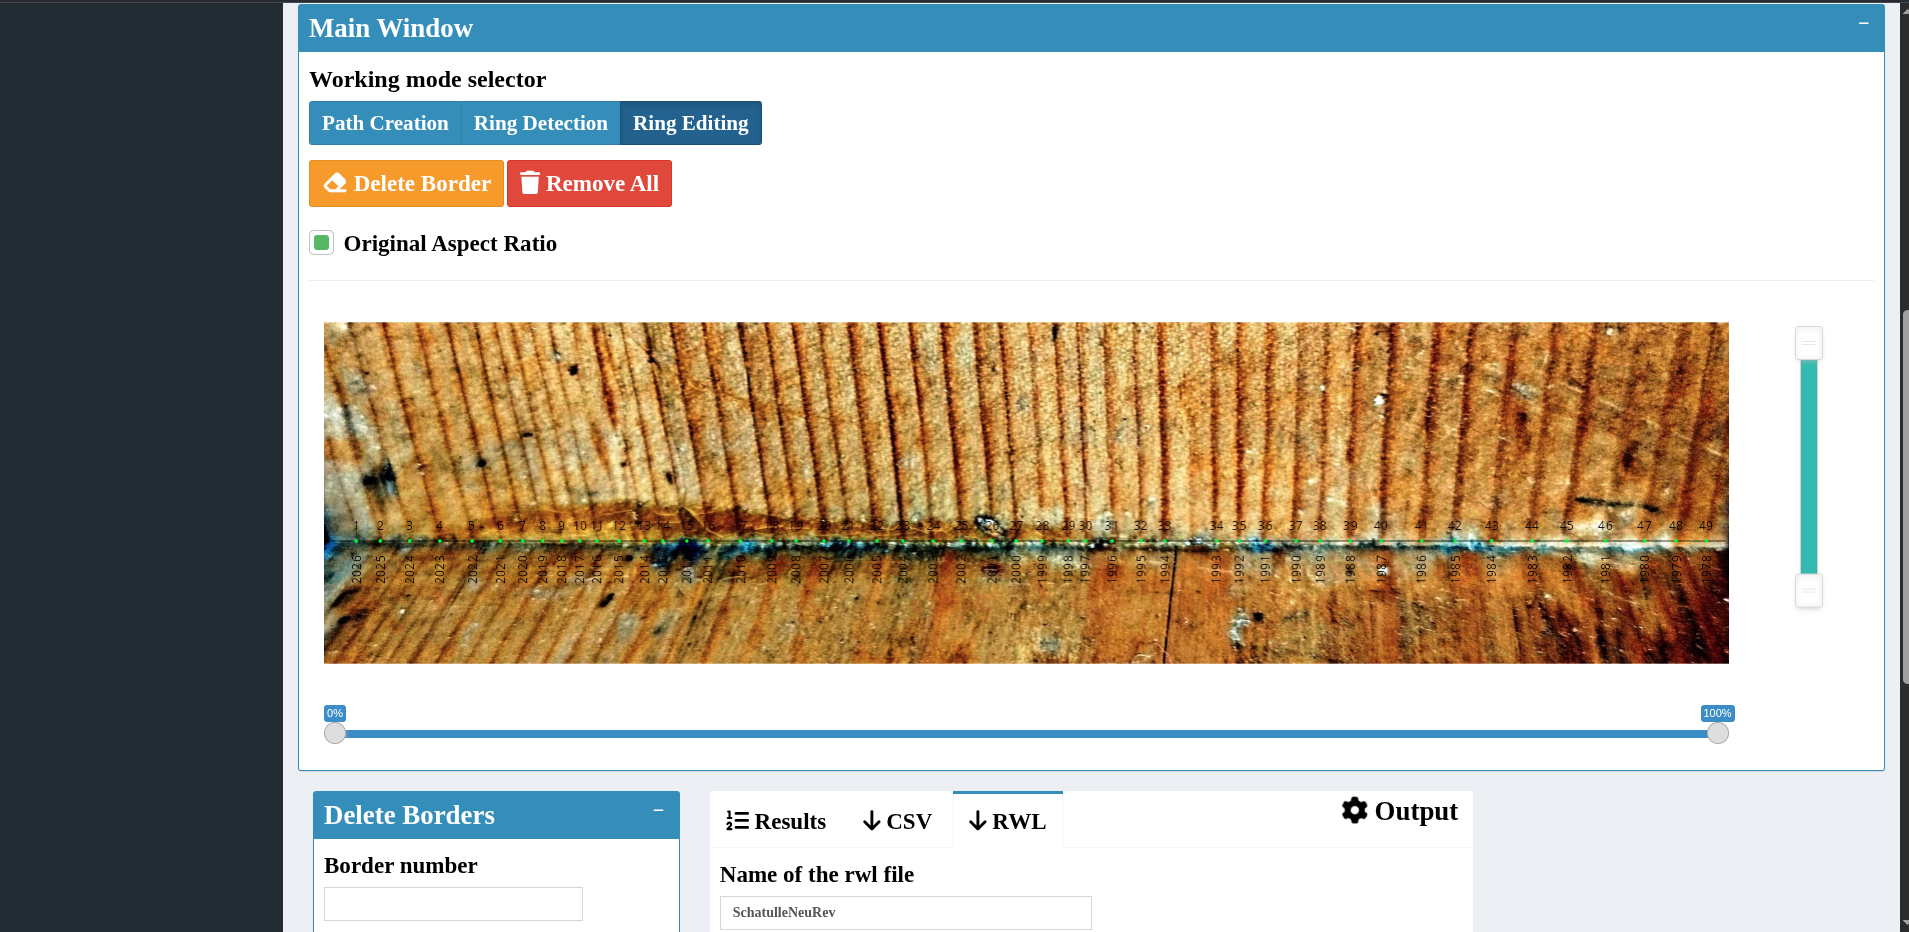
Now you can generate a series in the "Results"-tab...
.... and export it via the "RWL"-tab to get the .rwl-file for the next step.
If this short tutorial was not in depth enough, see this tutorial instead.
3rd Step: Choosing a dated series
To date the undated series we created in the last step, we need to choose a dated series as a reference.
There are various dated series of different tree species, time frames and regions available for free at the NOAA's Website. It is best to already know at least something about the wood you are analysing, for example the tree species, the expected age range and more or less rough idea of the region the wood originates from. Equally important is the size of the series and the age distribution within the series. If it is too irregular, datings in more sparse age ranges could be compromised.
As an example, I expect the wood I am analysing to be some kind of spruce or pine wood, ca 1650 CE to 1850 CE and somewhere in middle Europe, probably South Germany, Austria, Switzerland, Northern Italy or the former region of Bohemia. So I have choosen multiple dated series that somehow match my criteria.
4th Step: Crossdating using xDateR
The final step is to use xDateR. By clicking on the above link you can use an instance hosted by the Data Science faculty of the University of Arizona. A local instance similar to the MtreeRing application is also possible if preferred.
Import your chosen dated series (in .rwl format). In this example I have chosen the following dated series: https://doi.org/10.25921/rpwz-y440
Now we need to switch to the "Floater"-tab of xDateR and import our undated series we want to date.
Now we just need to wait a few seconds (or even minutes, depending on the size of the dated series) and get a best-fit result with a correlation coefficient.
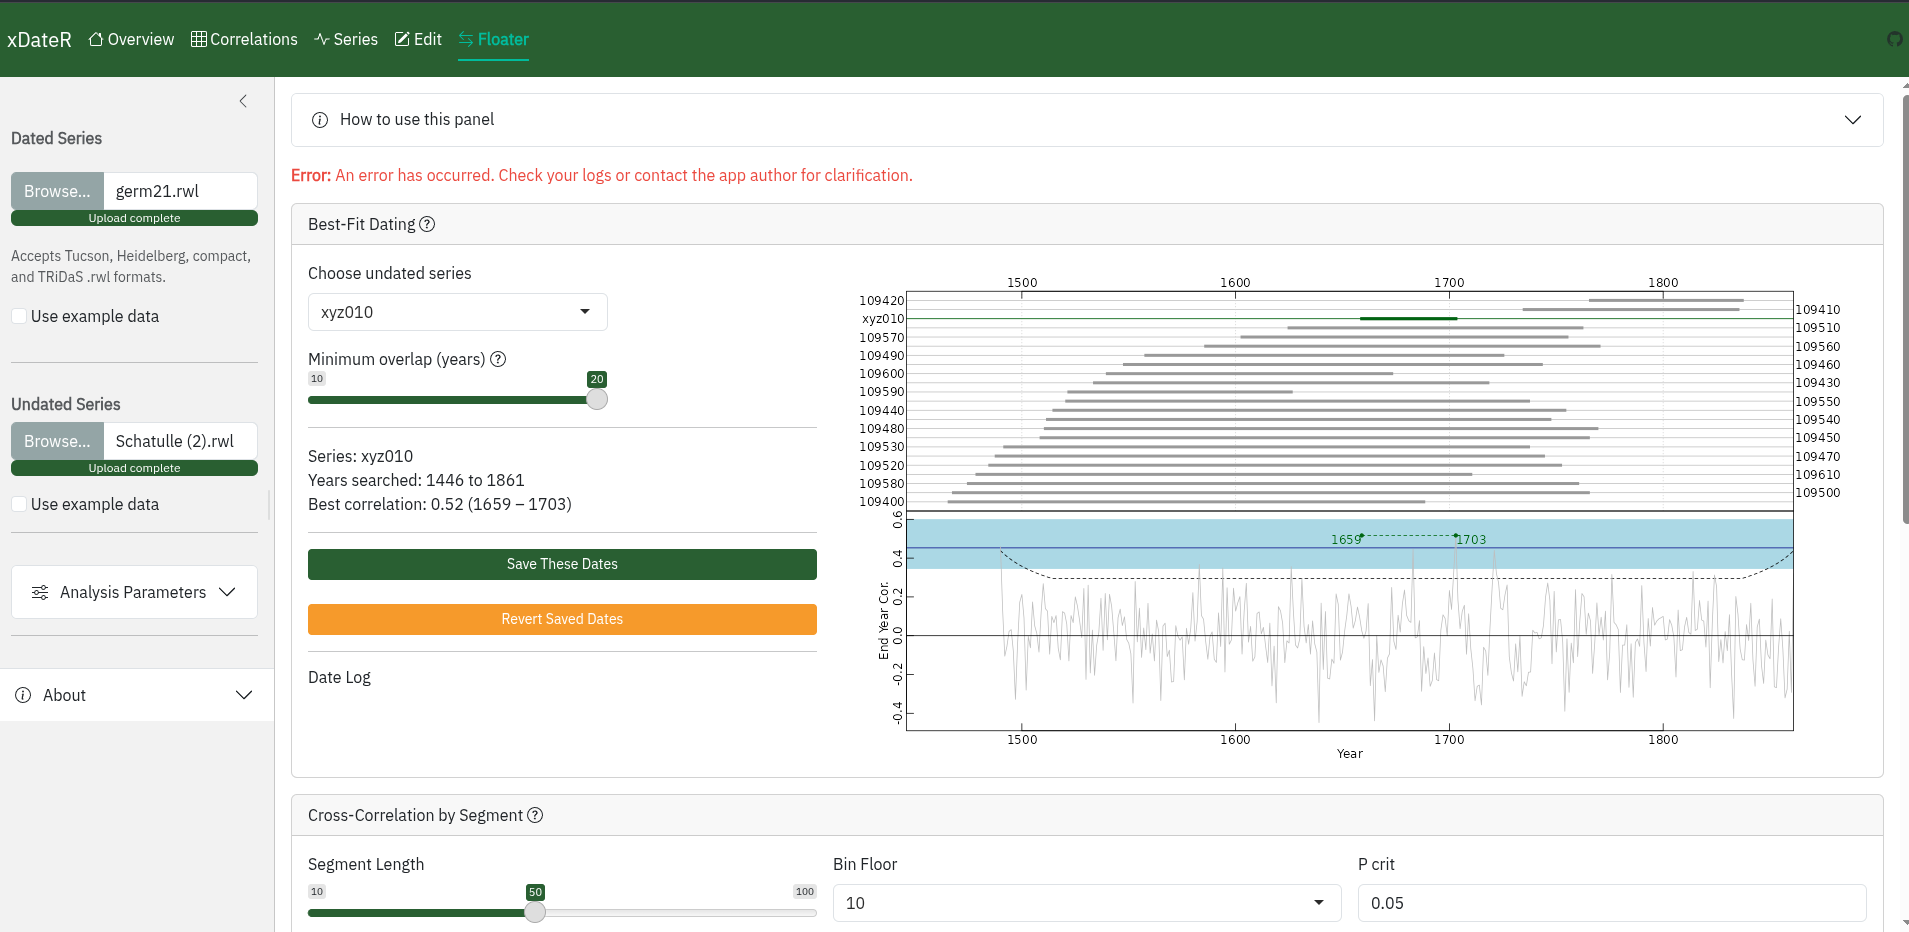
The graph on the right shows the undated series in its best-fit position along the dated series. The dark blue line shows the average correlation within the dated series, while the light blue box shows a percentile region around it.
Since the green dotted line, showing the correlation of the undated series in respect to the dated series, is well within the blue confidence zone, it is considered to be a relatively good result.
To make real assumptions on the age of the wood, you would need to take more series of different parts of it and also compare it to more dated series that would fit the wood, as described in step 3 of this introduction.
Choosing the right dated series can make a huge difference, as with some dated series I've tested, the wood was dated to the 12th century and with others, it was dated to the 1st half of the 20th century, which is both neither realistic nor expected.